XRP Price Aims for a Bullish Surge: Is a Major Move on the Horizon?

XRP price is slowly moving higher above the $0.5120 zone. It could start a major increase if there is a close above the $0.5320 resistance zone.
XRP is attempting a fresh increase above the $0.5220 zone.
The price is now trading above $0.520 and the 100-hourly Simple Moving Average.
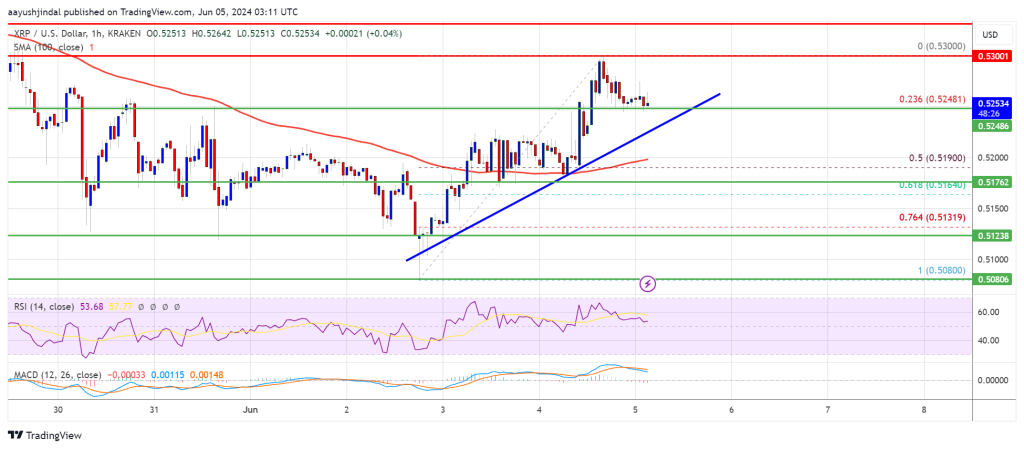
There is a connecting bullish trend line forming with support at $0.5240 on the hourly chart of the XRP/USD pair (data source from Kraken).
The pair could start a decent increase if there is a clear move above $0.5300.
XRP Price Holds Support
XRP price remained well-supported above the $0.500 zone and started a fresh increase like Bitcoin and Ethereum. The price was able to clear the $0.5120 and $0.5150 levels.
There was a clear move above the $0.5250 resistance and the price tested the $0.530 zone. A high was formed at $0.5300 and the price is now consolidating gains above the 23.6% Fib retracement level of the upward move from the $0.5080 swing low to the $0.5300 high.
The price is now trading above $0.5250 and the 100-hourly Simple Moving Average. There is also a connecting bullish trend line forming with support at $0.5240 on the hourly chart of the XRP/USD pair.
On the upside, the price is facing resistance near the $0.5280 level. The first key resistance is near $0.5300. The next major resistance is near the $0.5320 level. A close above the $0.5320 resistance zone could send the price higher. The next key resistance is near $0.5450.
If there is a close above the $0.5450 resistance level, there could be a steady increase toward the $0.5560 resistance. Any more gains might send the price toward the $0.5650 resistance.
Another Decline?
If XRP fails to clear the $0.530 resistance zone, it could start another decline. Initial support on the downside is near the $0.5240 level and the trend line.
The next major support is at $0.5190 or the 50% Fib retracement level of the upward move from the $0.5080 swing low to the $0.5300 high. If there is a downside break and a close below the $0.5190 level, the price might accelerate lower. In the stated case, the price could decline and retest the $0.5120 support in the near term.
Technical Indicators
Hourly MACD – The MACD for XRP/USD is now losing pace in the bullish zone.
Hourly RSI (Relative Strength Index) – The RSI for XRP/USD is now above the 50 level.
Major Support Levels – $0.5240 and $0.5190.
Major Resistance Levels – $0.5300 and $0.5320.
Welcome to Billionaire Club Co LLC, your gateway to a brand-new social media experience! Sign up today and dive into over 10,000 fresh daily articles and videos curated just for your enjoyment. Enjoy the ad free experience, unlimited content interactions, and get that coveted blue check verification—all for just $1 a month!
Account Frozen
Your account is frozen. You can still view content but cannot interact with it.
Please go to your settings to update your account status.
Open Profile Settings