
Ripple Price Analysis: What Are XRP’s Next Targets After Gaining 7% Daily?
Ripple’s price demonstrates a willingness to rally higher on both the USDT and BTC pair.
Yet, there are still some significant levels the market should overcome.
By TradingRage
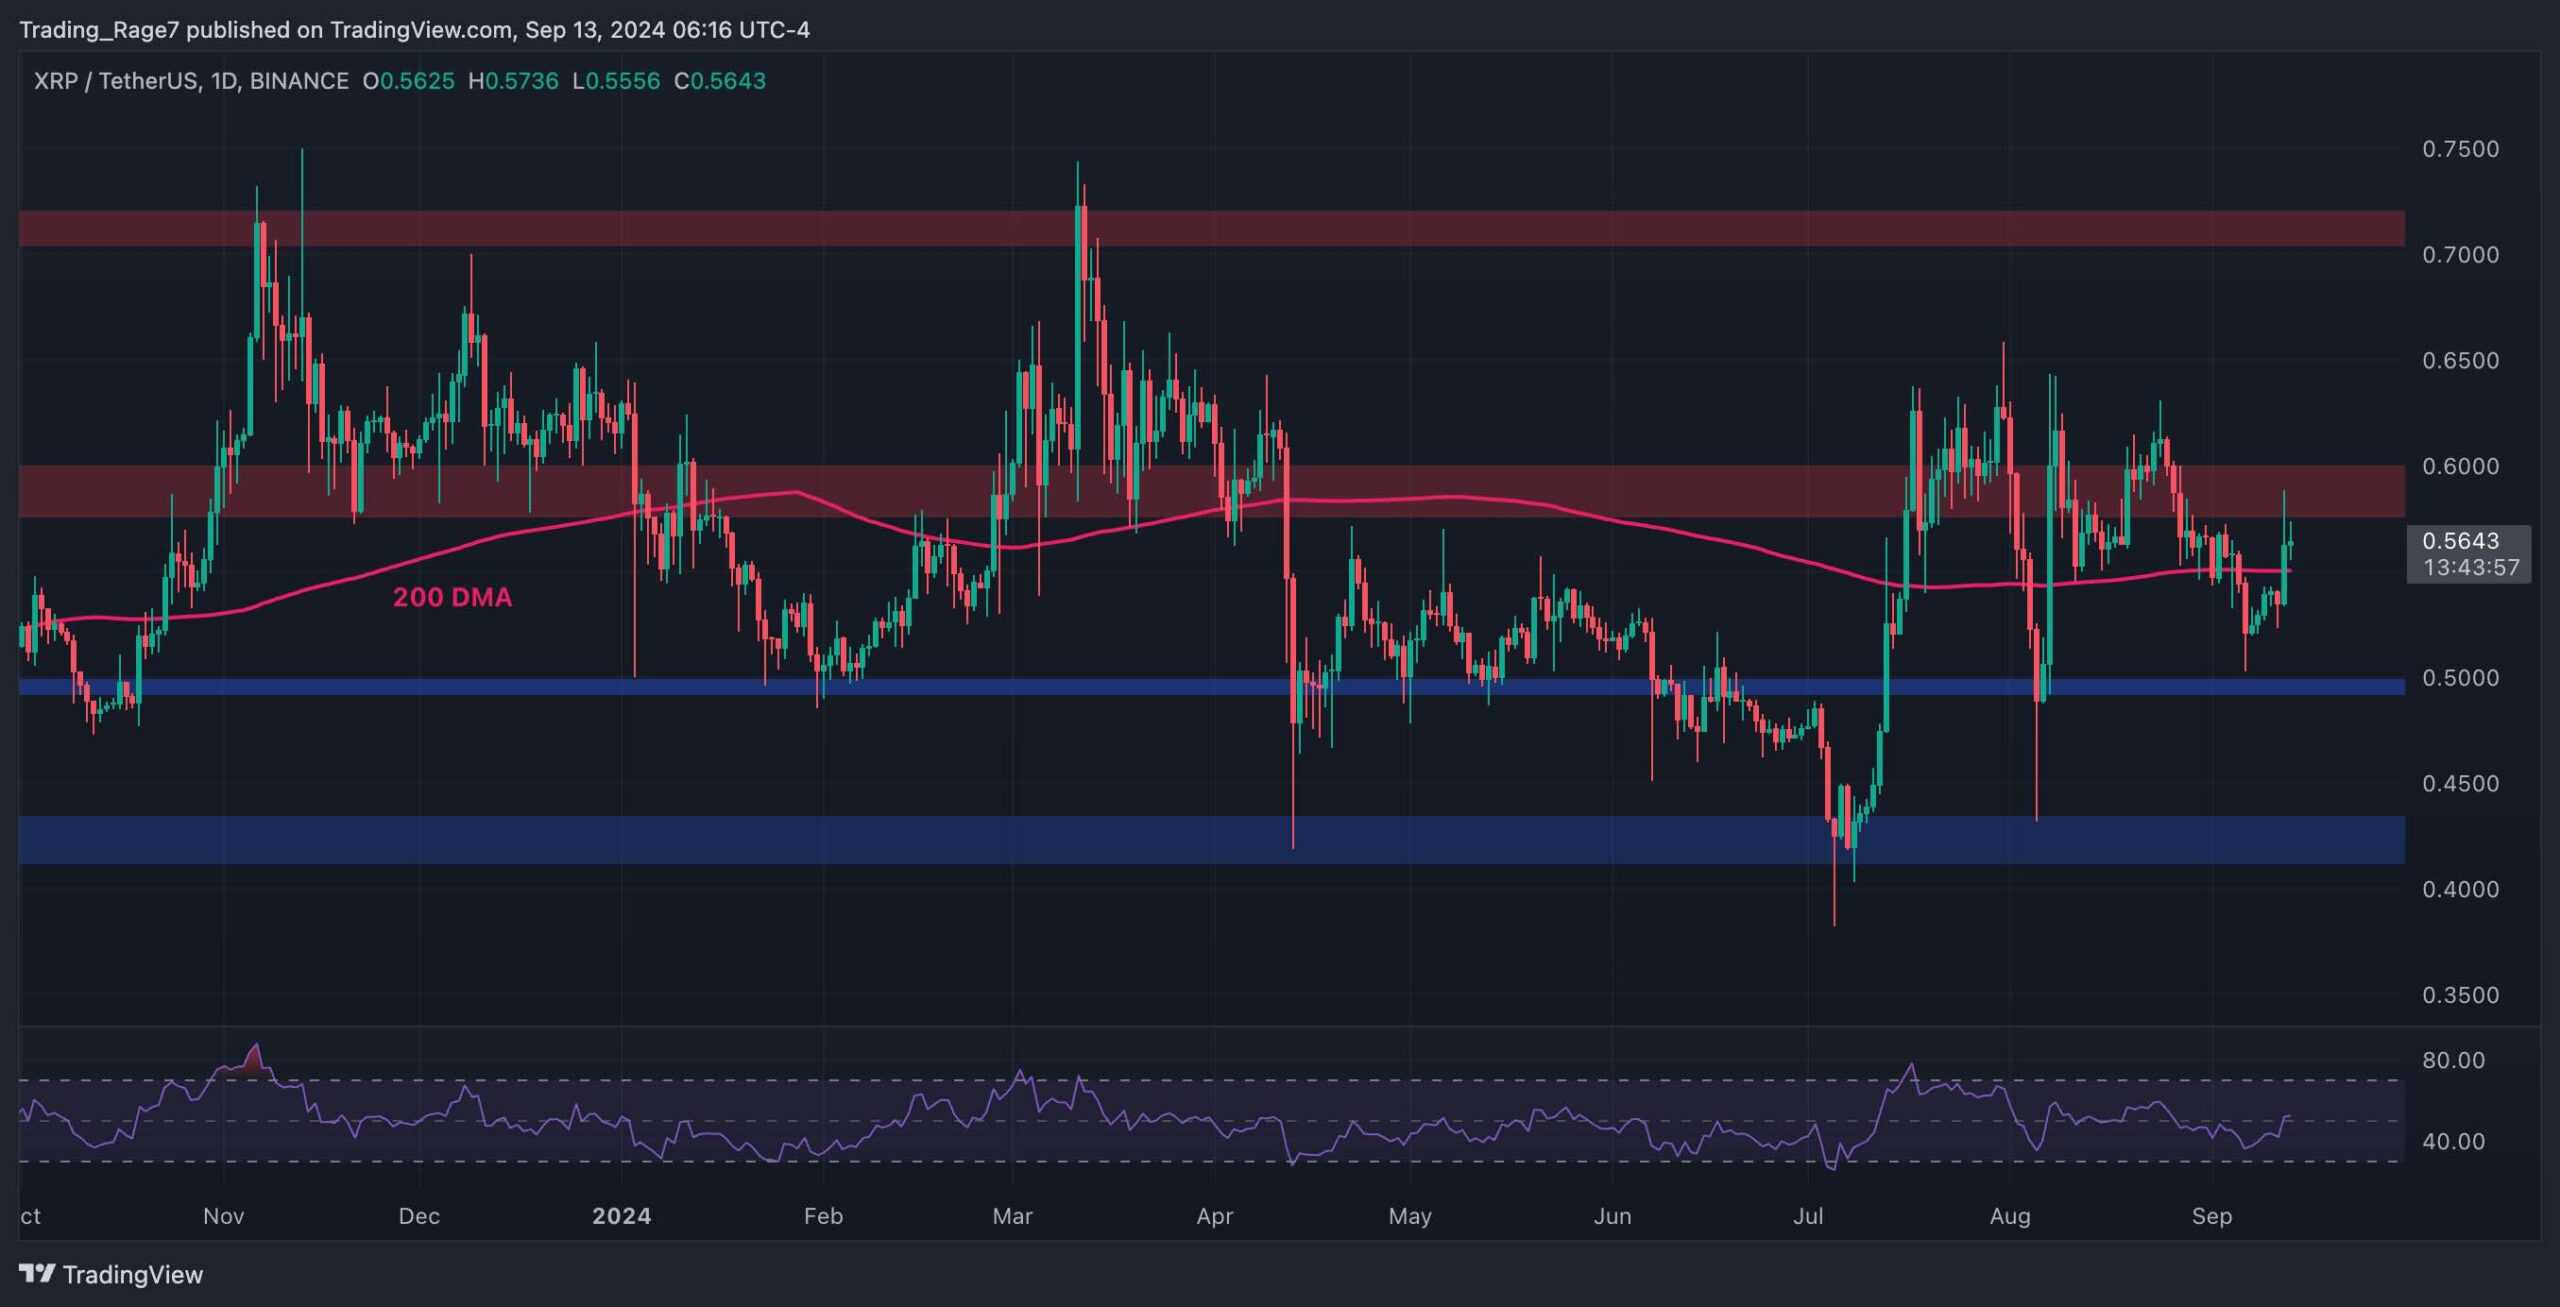
The USDT Paired Chart
On the USDT pair’s daily timeframe, the price broke above the 200-day moving average (located around the $0.55 mark) yesterday, following a swift rebound from the $0.5 level. Yet, the $0.6 resistance zone prevents the market from rallying higher.
Meanwhile, the RSI has risen above the 50% threshold, indicating a bullish market momentum shift. As a result, if the price keeps above the 200-day moving average, a rally above $0.6 could be expected in the short term.
The BTC Paired Chart
On the BTC paired chart, things seem quite similar, with the market rising above the 200-day moving average, currently located around the 850 SAT mark. The price action has been bullish recently, with the key 800 SAT level broken to the upside.
Therefore, the price will likely rise toward the 1200 SAT area in the coming weeks, as XRP looks set on beginning a bullish trend against BTC.
The post Ripple Price Analysis: What Are XRP’s Next Targets After Gaining 7% Daily? appeared first on CryptoPotato.
Welcome to Billionaire Club Co LLC, your gateway to a brand-new social media experience! Sign up today and dive into over 10,000 fresh daily articles and videos curated just for your enjoyment. Enjoy the ad free experience, unlimited content interactions, and get that coveted blue check verification—all for just $1 a month!
Account Frozen
Your account is frozen. You can still view content but cannot interact with it.
Please go to your settings to update your account status.
Open Profile Settings